


|
||||||
| Other Vehicles & General Automotive Discussions Discuss all other cars and automotive news here. |
 |
|
|
Thread Tools | Search this Thread |
 08-30-2022, 05:02 PM
|
#1135 | |
|
Senior Member

Join Date: Mar 2017
Drives: Q5 + BRZ + M796
Location: Santa Rosa, CA
Posts: 7,884
Thanks: 5,668
Thanked 5,810 Times in 3,300 Posts
Mentioned: 70 Post(s)
|
Quote:
Well, if we were dumping 1000x the amount of GHGs and the temperature was going up 5 degrees each year then that might shorten your timeline, but for you, the changes are too slow and the GHGs are too few to matter on a 150 year timeline. Okay, then just say that and begone with the debate instead of stringing everyone along on a pointless exercise with no end in sight. This is why Spuds was trying to tease out your standards and why asked what was your timeline for your long-term criteria because we both knew that we would be wasting our time with pointless errands fetching data when the data doesn't exist because the event has been too brief for your criteria. The last time the CO2 was 420+ppm, the world was 8-10+ degrees F warmer than it is today. At 1000ppm, the earth was 25+ degrees warmer. That is the average, and the extremes are worse. Maybe rising CO2 now won't cause the same temperature that correlated to the CO2 in the past, which is probably why the models are more conservative with their temperature estimates. Regardless, most people don't want to wait around to see what happens when CO2 levels get to 500+ and take a chance with what the temperature could be like. We use to add 1ppm/year, but it is at 2.37ppm/year. That rate is rising too. Even if the rate stayed flat, in fifty years we would be around 550ppm. In 200 years we would be at 1000ppm, assuming this didn't kick off a feedforward effect.  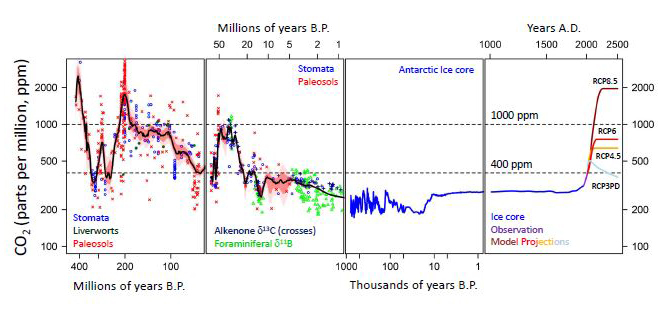
__________________
My Build | K24 Turbo Swap | *K24T BRZ SOLD*
|
|

|

|
| The Following User Says Thank You to Irace86.2.0 For This Useful Post: | ZDan (08-30-2022) |
|
08-30-2022, 06:01 PM
|
#1136 | |
|
Senior Member
Join Date: Mar 2017
Drives: _
Location: _
Posts: 440
Thanks: 50
Thanked 178 Times in 104 Posts
Mentioned: 4 Post(s)
|
Quote:
Cherry picking... like selecting only the convenient 150-160 year window while the rest of it disproves the author? The minute you say an author is a denialist quack, it immediately shows a prejudice and bias. You're putting everyone who disagrees with you under an umbrella term, and categorically rejecting everything they say. And somehow you claim that you're unbiased? Last edited by chipmunk; 08-30-2022 at 06:36 PM. |
|
|
|
|
|
08-30-2022, 06:06 PM
|
#1137 | |
|
Senior Member
Join Date: Mar 2017
Drives: _
Location: _
Posts: 440
Thanks: 50
Thanked 178 Times in 104 Posts
Mentioned: 4 Post(s)
|
Quote:
Why is the present CO2 not causing the same temp rise as in the past, despite the depletion of O3 and elevated Methane levels? |
|
|
|
|
|
08-30-2022, 06:19 PM
|
#1138 | |
|
Senior Member
Join Date: Mar 2017
Drives: _
Location: _
Posts: 440
Thanks: 50
Thanked 178 Times in 104 Posts
Mentioned: 4 Post(s)
|
Quote:
|
|
|
|
|
|
08-30-2022, 06:37 PM
|
#1139 | |
|
Senior Member
Join Date: Mar 2017
Drives: Q5 + BRZ + M796
Location: Santa Rosa, CA
Posts: 7,884
Thanks: 5,668
Thanked 5,810 Times in 3,300 Posts
Mentioned: 70 Post(s)
|
Quote:
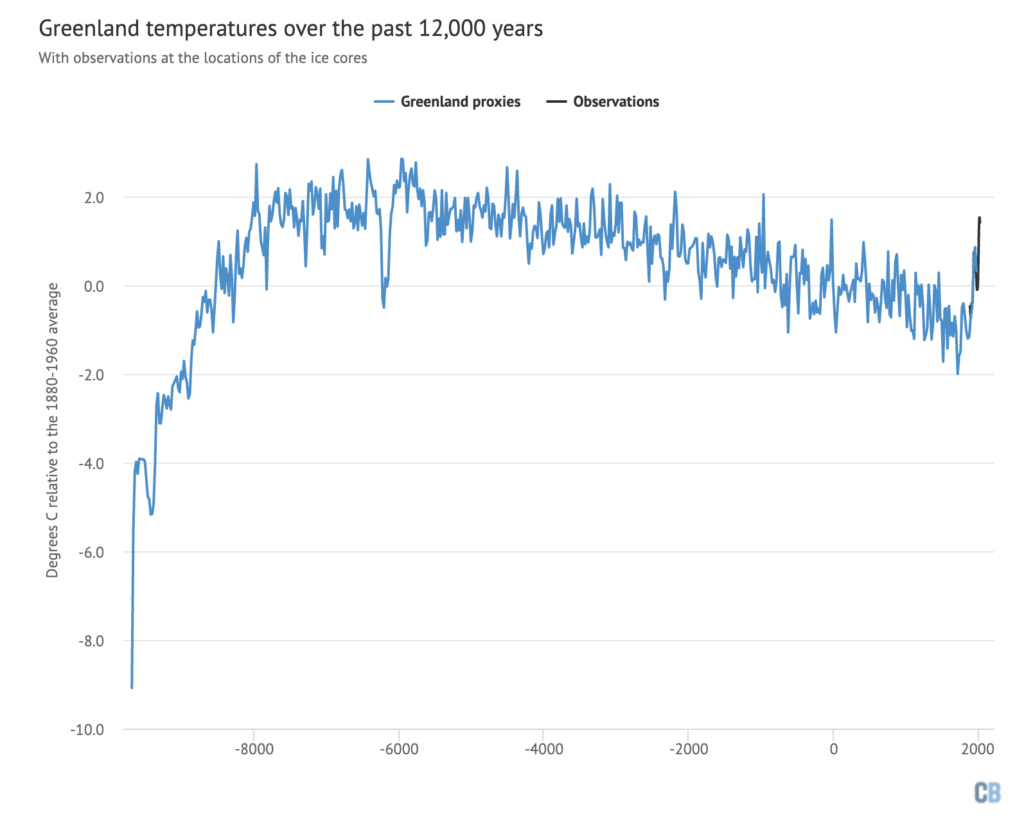 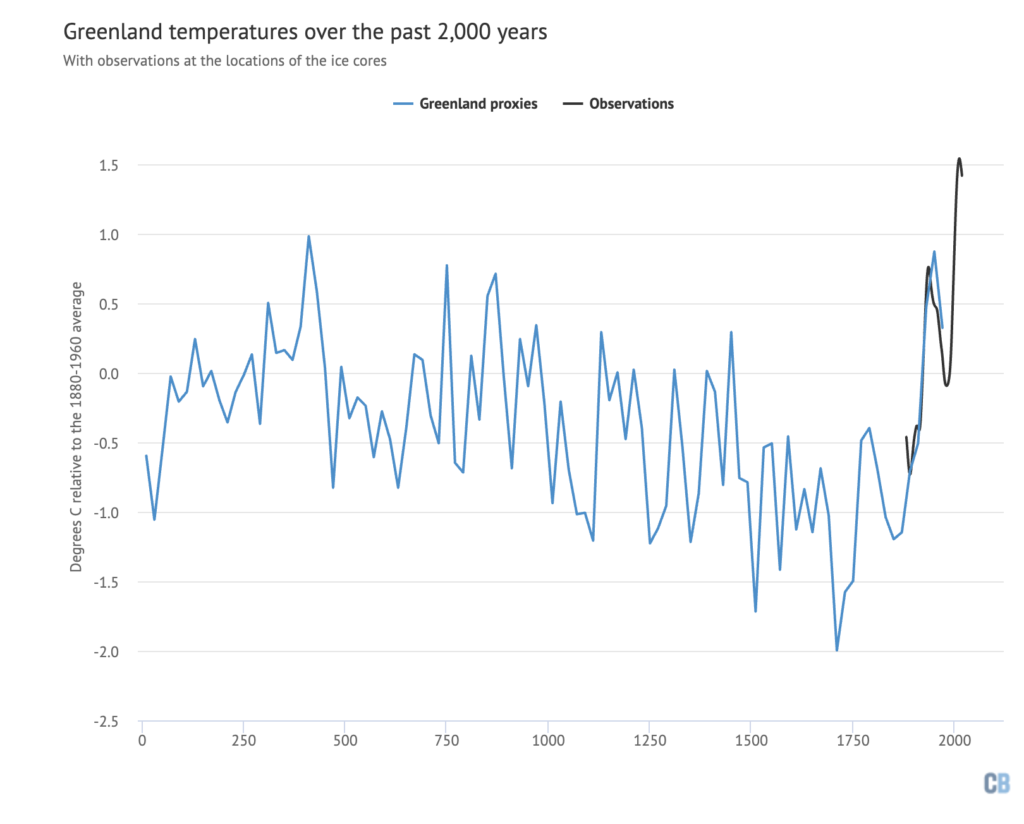 https://www.carbonbrief.org/factchec...limate-change/
__________________
My Build | K24 Turbo Swap | *K24T BRZ SOLD*
|
|
|
|
|
|
08-30-2022, 06:39 PM
|
#1140 | |||
|
Senior Member

Join Date: May 2011
Drives: '23 BRZ
Location: Providence, RI
Posts: 4,672
Thanks: 1,439
Thanked 4,012 Times in 2,098 Posts
Mentioned: 85 Post(s)
|
Quote:
I am certainly not *discarding* data from other eras! Of course they provide great *context* for what is happening now. Quote:
Quote:
|
|||
|
|
|
| The Following User Says Thank You to ZDan For This Useful Post: | Irace86.2.0 (08-30-2022) |
|
08-30-2022, 06:39 PM
|
#1141 | |
|
Senior Member
Join Date: Mar 2017
Drives: _
Location: _
Posts: 440
Thanks: 50
Thanked 178 Times in 104 Posts
Mentioned: 4 Post(s)
|
Quote:
|
|
|
|
|
|
08-30-2022, 06:43 PM
|
#1142 | |
|
Senior Member
Join Date: Mar 2017
Drives: _
Location: _
Posts: 440
Thanks: 50
Thanked 178 Times in 104 Posts
Mentioned: 4 Post(s)
|
Quote:
Seriously, where is your data from? |
|
|
|
|
|
08-30-2022, 06:50 PM
|
#1143 | |
|
The Dictater

Join Date: Apr 2017
Drives: '13 Red Scion FRS
Location: MD, USA
Posts: 9,683
Thanks: 26,748
Thanked 12,739 Times in 6,313 Posts
Mentioned: 88 Post(s)
|
Quote:
However, the data shows that within the last few hundred years we are currently experiencing an event where the 'dry' greenhouse gasses (CO2 and CH4) are going through the roof without temperature preceding it. I believe we all agree on that as well? So the question is 'why has the pattern changed'. What makes the last few hundred years different than the last half-million? As you said, any other 160 year period would show different results than the last 160 years. Why do you think that is? What prediction can you make about the next 160 years from this data? 1000 years? |
|
|
|
|
| The Following User Says Thank You to Spuds For This Useful Post: | Irace86.2.0 (08-30-2022) |
|
08-30-2022, 06:55 PM
|
#1144 | |
|
The Dictater
Join Date: Apr 2017
Drives: '13 Red Scion FRS
Location: MD, USA
Posts: 9,683
Thanks: 26,748
Thanked 12,739 Times in 6,313 Posts
Mentioned: 88 Post(s)
|
Quote:
|
|
|
|
|
|
08-30-2022, 06:59 PM
|
#1145 | |||
|
Senior Member
Join Date: Mar 2017
Drives: Q5 + BRZ + M796
Location: Santa Rosa, CA
Posts: 7,884
Thanks: 5,668
Thanked 5,810 Times in 3,300 Posts
Mentioned: 70 Post(s)
|
Quote:
Quote:
https://www.newswise.com/factcheck/r...icle_id=772662 The paper I cited goes through the challenge of making a causal argument, which is why they said: Quote:
https://www.ncbi.nlm.nih.gov/pmc/articles/PMC4761980/
__________________
My Build | K24 Turbo Swap | *K24T BRZ SOLD*
|
|||
|
|
|
|
08-30-2022, 07:05 PM
|
#1146 | |
|
The Dictater
Join Date: Apr 2017
Drives: '13 Red Scion FRS
Location: MD, USA
Posts: 9,683
Thanks: 26,748
Thanked 12,739 Times in 6,313 Posts
Mentioned: 88 Post(s)
|
Quote:
Irregardless would be a double negative. Like Irregular means to be non-regular. Pet peeve. Carry on. |
|
|
|
|
|
08-30-2022, 07:08 PM
|
#1147 | |
|
Senior Member
Join Date: Mar 2017
Drives: Q5 + BRZ + M796
Location: Santa Rosa, CA
Posts: 7,884
Thanks: 5,668
Thanked 5,810 Times in 3,300 Posts
Mentioned: 70 Post(s)
|
Quote:
__________________
My Build | K24 Turbo Swap | *K24T BRZ SOLD*
|
|
|
|
|
| The Following User Says Thank You to Irace86.2.0 For This Useful Post: | ZDan (08-31-2022) |
|
08-30-2022, 07:08 PM
|
#1148 | |
|
Senior Member
Join Date: Mar 2017
Drives: _
Location: _
Posts: 440
Thanks: 50
Thanked 178 Times in 104 Posts
Mentioned: 4 Post(s)
|
Quote:
We are all in agreement that emissions have gone up, especially CO2 and CH4. The fact that the temperatures didn't follow them should make anyone question if something is missing in the equation. Right now we're debating over a 1 deg C rise in EPICA measurements over the average, but there were times when the temperatures were higher at much lower CO2 levels. Given how little CO2 is in the atmosphere, these correlations makes no sense. I'm gonna venture out on a limb here and make a conjecture - there is some element that has a larger effect. Probably water vapor? I don't know! But looking at CO2 as the only demon has very little data to support. If people want to reduce pollutants like CO, NOx, etc., then yes, by all means! But even if we reduce CO2 to zero tonight, there's no guarantee that this would result in any change in temperatures. |
|
|
|
|
|
|
|
|
|
|
 Similar Threads
|
||||
| Thread | Thread Starter | Forum | Replies | Last Post |
| Tcoat banned? | Hotrodheart | Off-Topic Lounge [WARNING: NO POLITICS] | 95 | 07-06-2019 01:46 AM |
| Does anyone know why pansontw got banned? | Soloside | Off-Topic Lounge [WARNING: NO POLITICS] | 17 | 10-26-2018 04:20 AM |
| Got banned from gf's complex | jdmblood | Other Vehicles & General Automotive Discussions | 11 | 07-12-2015 12:46 PM |
| Why have so many users been banned? | xuimod | Site Announcements / Questions / Issues | 9 | 03-08-2015 02:23 PM |
| Banned Toyota GT 86 Advert Banned | Nevermore | FR-S & 86 Photos, Videos, Wallpapers, Gallery Forum | 9 | 11-16-2012 07:27 PM |


