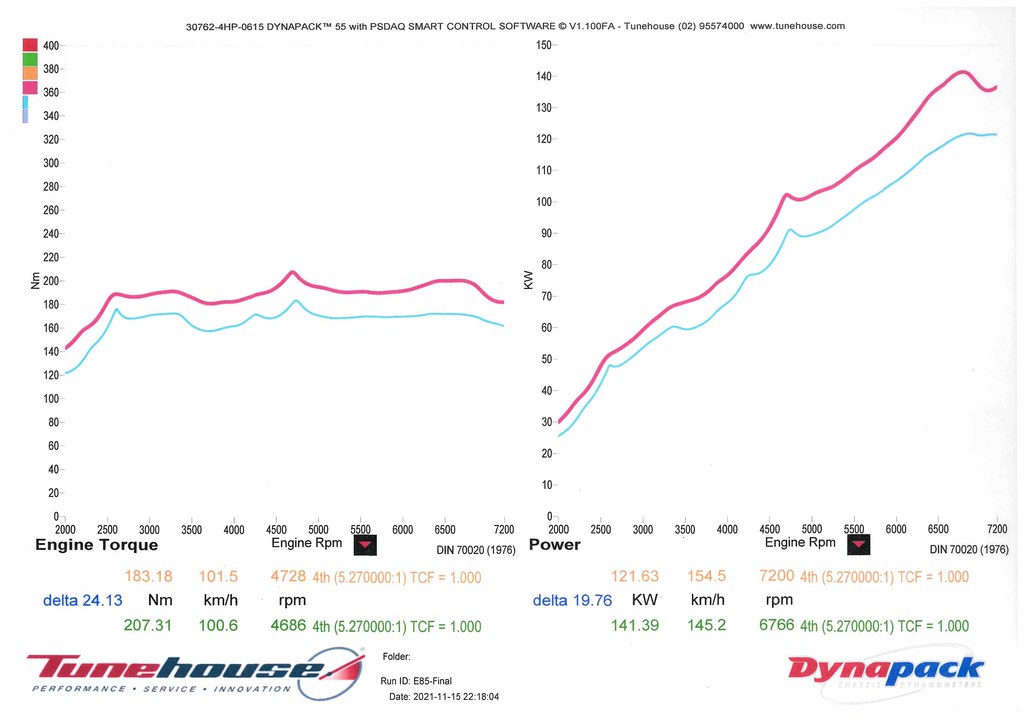
Hi all, sent my car for a tune on 98 RON (Aus) (which is apparently equal to 93 over in the US) back 9 months ago. Just got it retuned for E85 (and flex). All in all, very happy with the results from Tunehouse Racing in Sydney. They use a Dynapack hub dyno.
Engine mods:
Grimmspeed Dry-con panel filter
Tomei UEL Catless headers
Invidia Q300 Cat-back
Zeitronix ECA-2 Ethanol Content Analyser
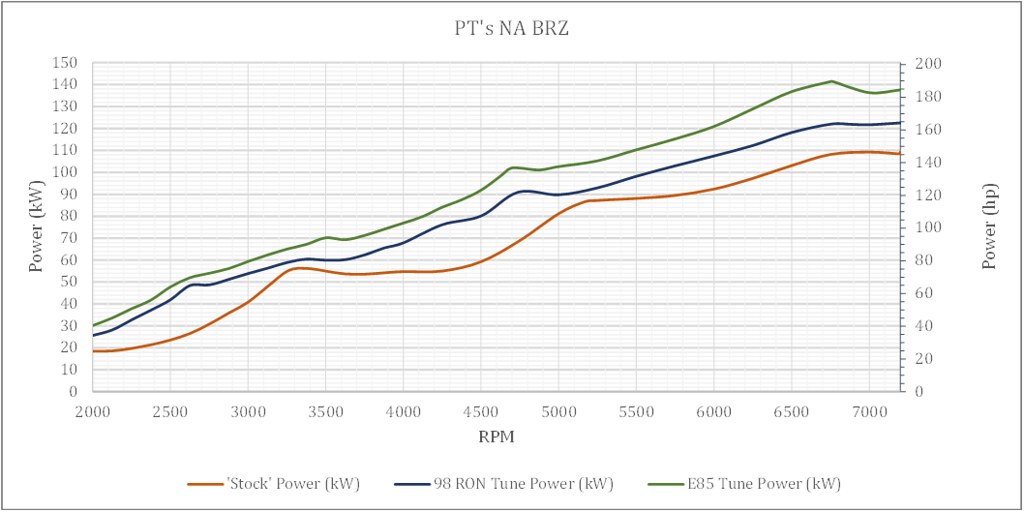
Typically, dyno results can vary wildly due to calibration differences or due to the type of dyno used, so what we always want to look for when comparing dyno results is the % difference. Luckily, it seems that between my first tune in March and my most recent tune, Tunehouse did a base run to calibrate the two 98 tunes. Hence I could combine the three runs together for comparison purposes. I painstakingly plotted out the dyno charts from Tunehouse as accurately as I could into Excel so that I could present it all on the one graph.
One note about my 'stock' run is that it was performed with all the bolt-ons already installed. Hence why I've labelled 'stock' in inverted commas.
Peak Torque:
'Stock' - 161.7 Nm (119.2 ft.lbf)
98 Tune - 183.2 Nm (135.1 ft.lbf) (113%)
E85 Tune - 207.3 Nm (152.9 ft.lbf) (128%; 113% of 98 Tune)
Peak Power:
'Stock' - 108.5 kW (145.4 hp)
98 Tune - 121.9 kW (168.5 hp) (112%)
E85 Tune - 141.4 kW (189.6 hp) (130%; 116% of 98 Tune)
Now, I've never been a huge fan of comparing peak torque and peak power so I integrated the torque curve to find out the increase in the area under the graph. Using this metric, I approximately calculated:
Area Under the Torque Graph (2000 - 7200 RPM)
'Stock' - 100%
98 Tune - 123%
E85 Tune - 136% (111% of 98 Tune)
Also interested in the increase in area relevant to your day to day driving
Area Under the Torque Graph (2000 - 4000 RPM)
'Stock' - 100%
98 Tune - 133%
E85 Tune - 149% (113% of 98 Tune)
Further analysis below:

 Stock vs 98 Tune
 98 Tune vs E85