Fuel Eco Graphs
I have a heavy foot! The more mods that went on the more fun I had and the more petrol I used. #science
Here is my 2012 Complete graph. I put the pricing I paid per US Gallon to show trends. Fuel prices go down in the winter here in Texas.
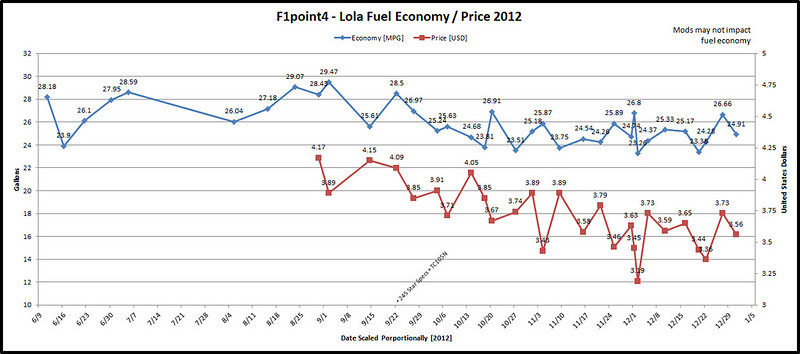 20130403-FuelEconomy-001
 by
VictorN07, on Flickr
Here is my 2013 YTD. The supercharger had an immediate and noticeable impact on fuel economy. The one time I got 24.11 was when I did almost all highway driving on that tank. I would say I would average 21mpg with the supercharger on my normal commute. The last bullet point shows my economy going up as a result of temporarily switching back to NA. Prices are going back up
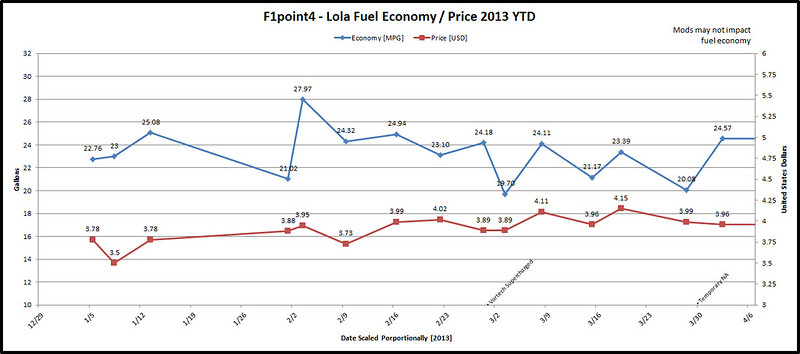 20130403-FuelEconomy-002
 by
VictorN07, on Flickr