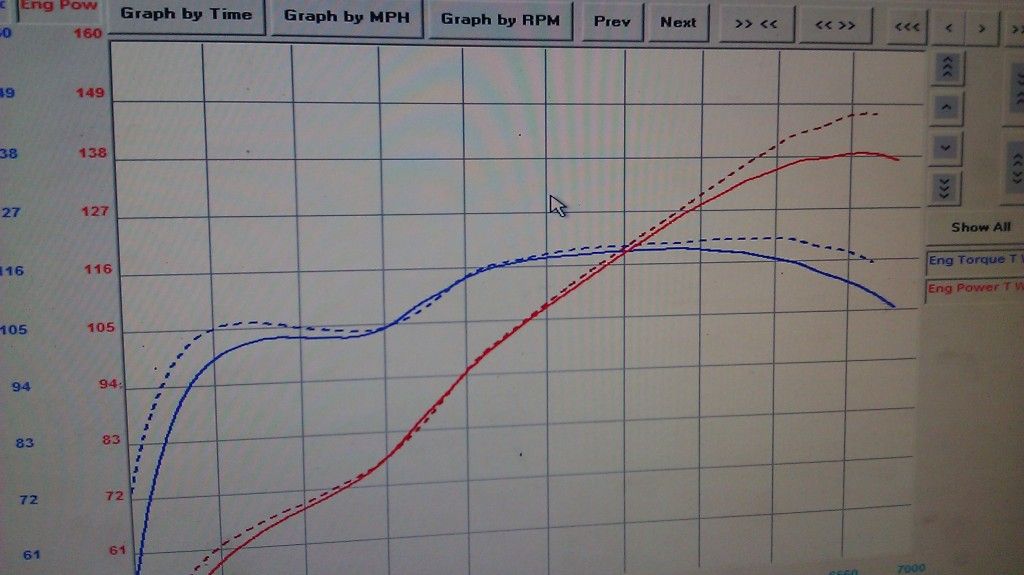
Things will vary on the display for the graph. I dont use much smoothing when tuning since that minimizes the amount of dip i can see. I want to see the dips for tuning purposes since this relays a lot of info such as misfire/detonation etc but for a sales standpoint its not that pretty. Here is another image with the smoothing increased some that shows there is significant gains down low. Also the break points on the graph play a large roll in the amount of separation you see in the graphs. I have made it a bit easier to read now with those more familiar with dynojet graphs