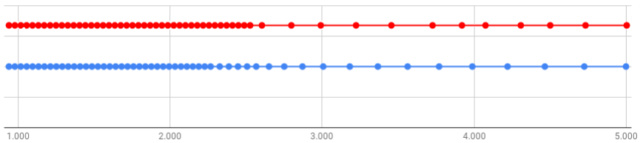
I find that the distribution of the points on the X-axis of the stock Maf scale is a bit odd.
The distance between all the first points is equal, this ensure a good resolution in this area and that is fine. But in the second half, the distance between the points increases, then decreases (see the two points around 4V), and then increases again.

Did anyone noticed this before, and do you what is the reason for that ?
The red doted line is the stock scale
The blue line is the new scale I just built up and I am about to use. It is more progressive, as a result it has less resolution in the unused area above 4.2v and better resolution between 2.5v and 4v
What do you think about it ? Am I doing a mistake here ?