I've been hard at work getting some really useful new features ready for Datazap. I just pushed them live so go and try them out right now!
(Clear your browser cache if anything seems off). I hope you all enjoy this! Consider donating if you like what I'm doing, it's much appreciated.
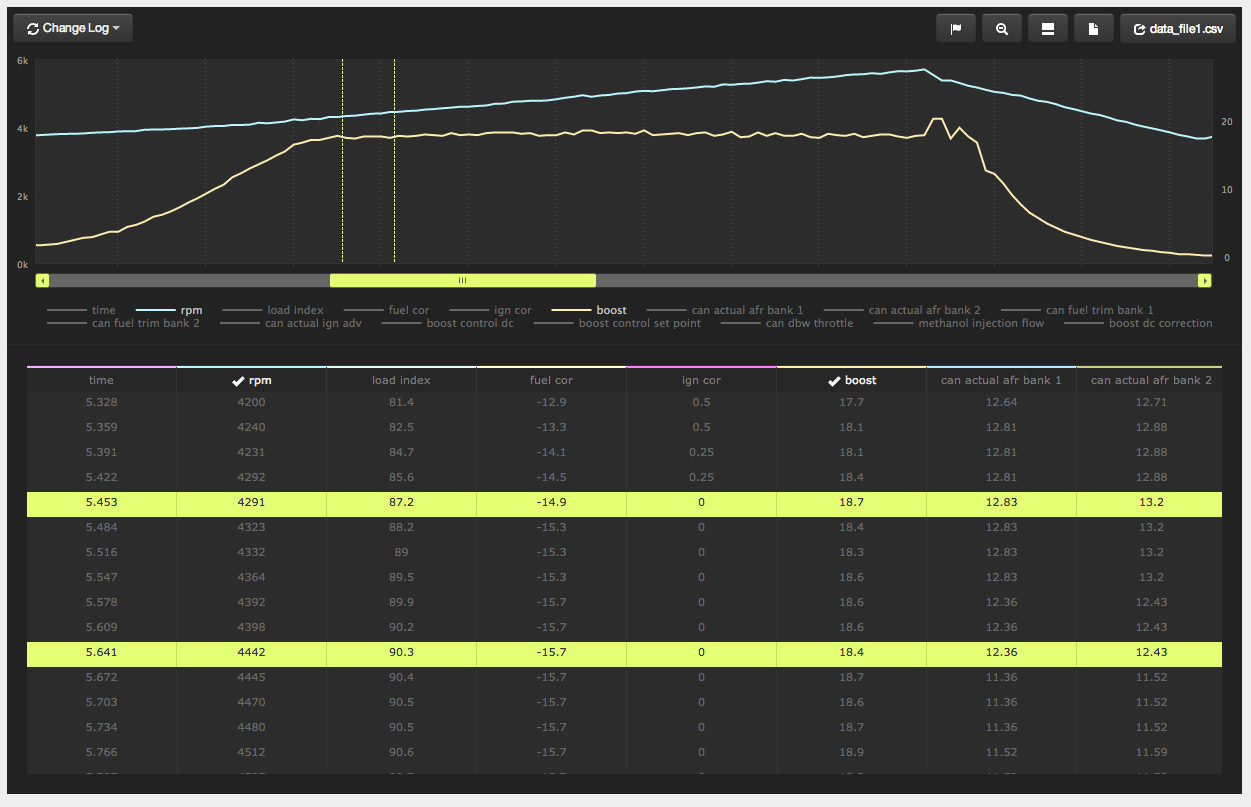
You'll now see a grid view of the raw data (right under the main graph) in a spreadsheet-like format. For those of you who like to see it in that format don't have to download the .csv and bother with excel any more.
To make it as useful and easy to consume as possible I added in some really cool features. This isn't just a static grid of data:
- As you mouse-over the graph, the data grid automatically follows your position in time and scrolls to the proper location.
- If you mouse over a line on the graph that has a column in the grid which is out of view, it will jump to that position so you don't have to manually scroll horizontally to find it. (you can if you want though)
- When you set markers in the graph, that specific row in the grid will highlight (this of course is persistent when sharing the URL)
- When scrolling through the grid itself, the row and column highlights as you mouse over the cell for easy reading. I also added in little indicators to show what columns are active/visible in the graph. Also they are color coded to match the legend in the graph area.
- There's also a layout toggle button so you can shrink the graph and have a bigger view of the spreadsheet area. Click it again to swap back
Here's a quick video demonstrating these new features:
[ame="https://www.youtube.com/watch?v=OJKgW3F5kvs"]Datazap Update! Interactive Raw Data Grid - YouTube[/ame]
A couple screenshots incase you can't watch that at work:
normal layout:
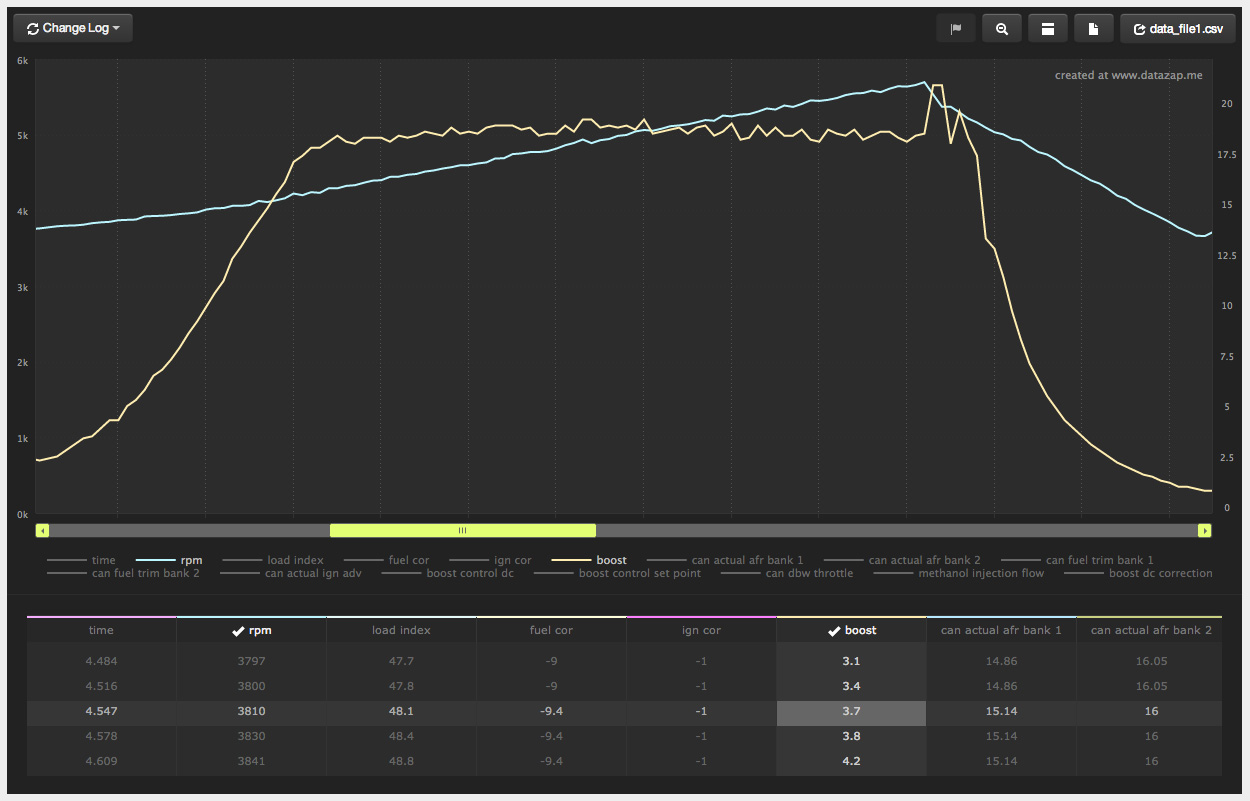
bigger spreadsheet area:
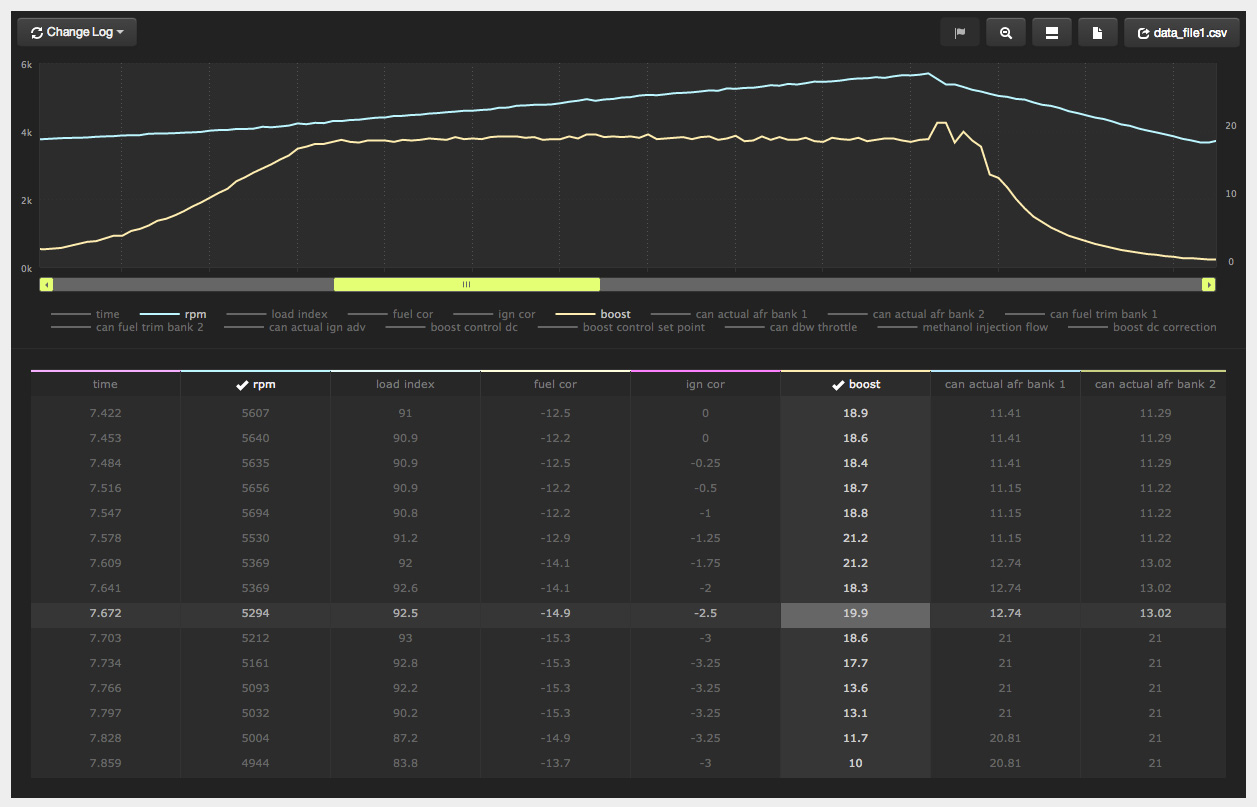
a couple markers in the graph, and their corresponding highlighted rows in the grid: